Today, we’re going to take a look at an example created from dataset from Northern Gas Networks.
The files used can be downloaded from here.
The connectivity of this network has been checked and rectified using a combination of the Network Cleanup Tools available from the plugin.
Once confirmed, the model was abstracted using Network Component Creator.
Pipeflow
A fluid model in Pipeline Engineer is made up of a series of GIS Layers. Each layer represents a pandapipes data structure.
Right from download, you’ll be able to drag the GeoPackage (.gpkg) file into QGIS and run a pipeflow from the Processing Toolbox.
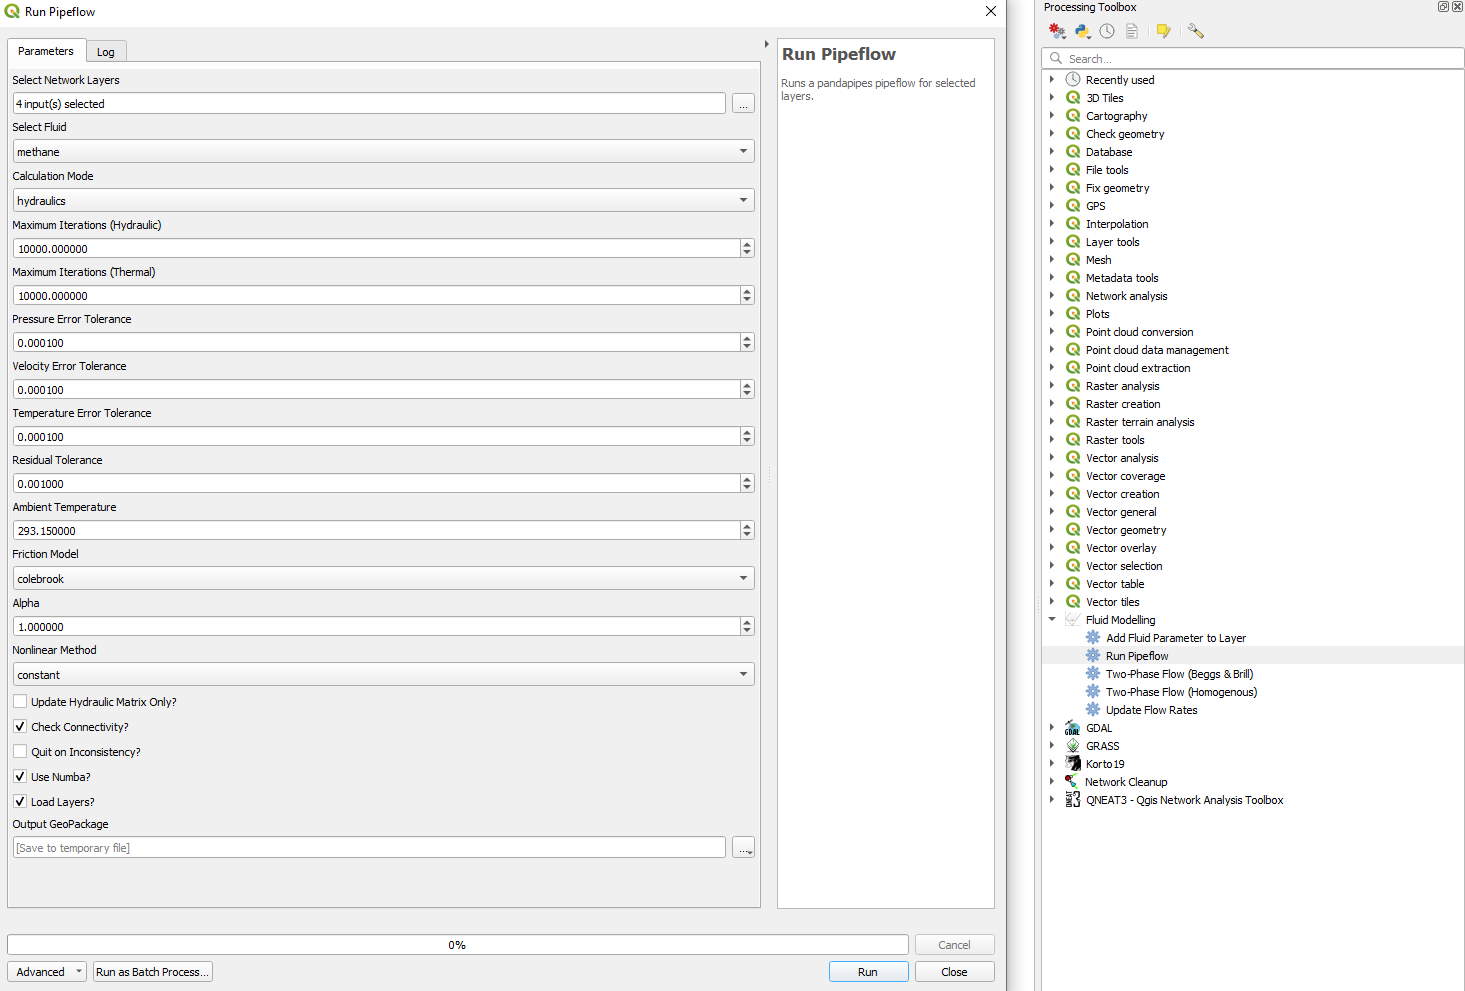
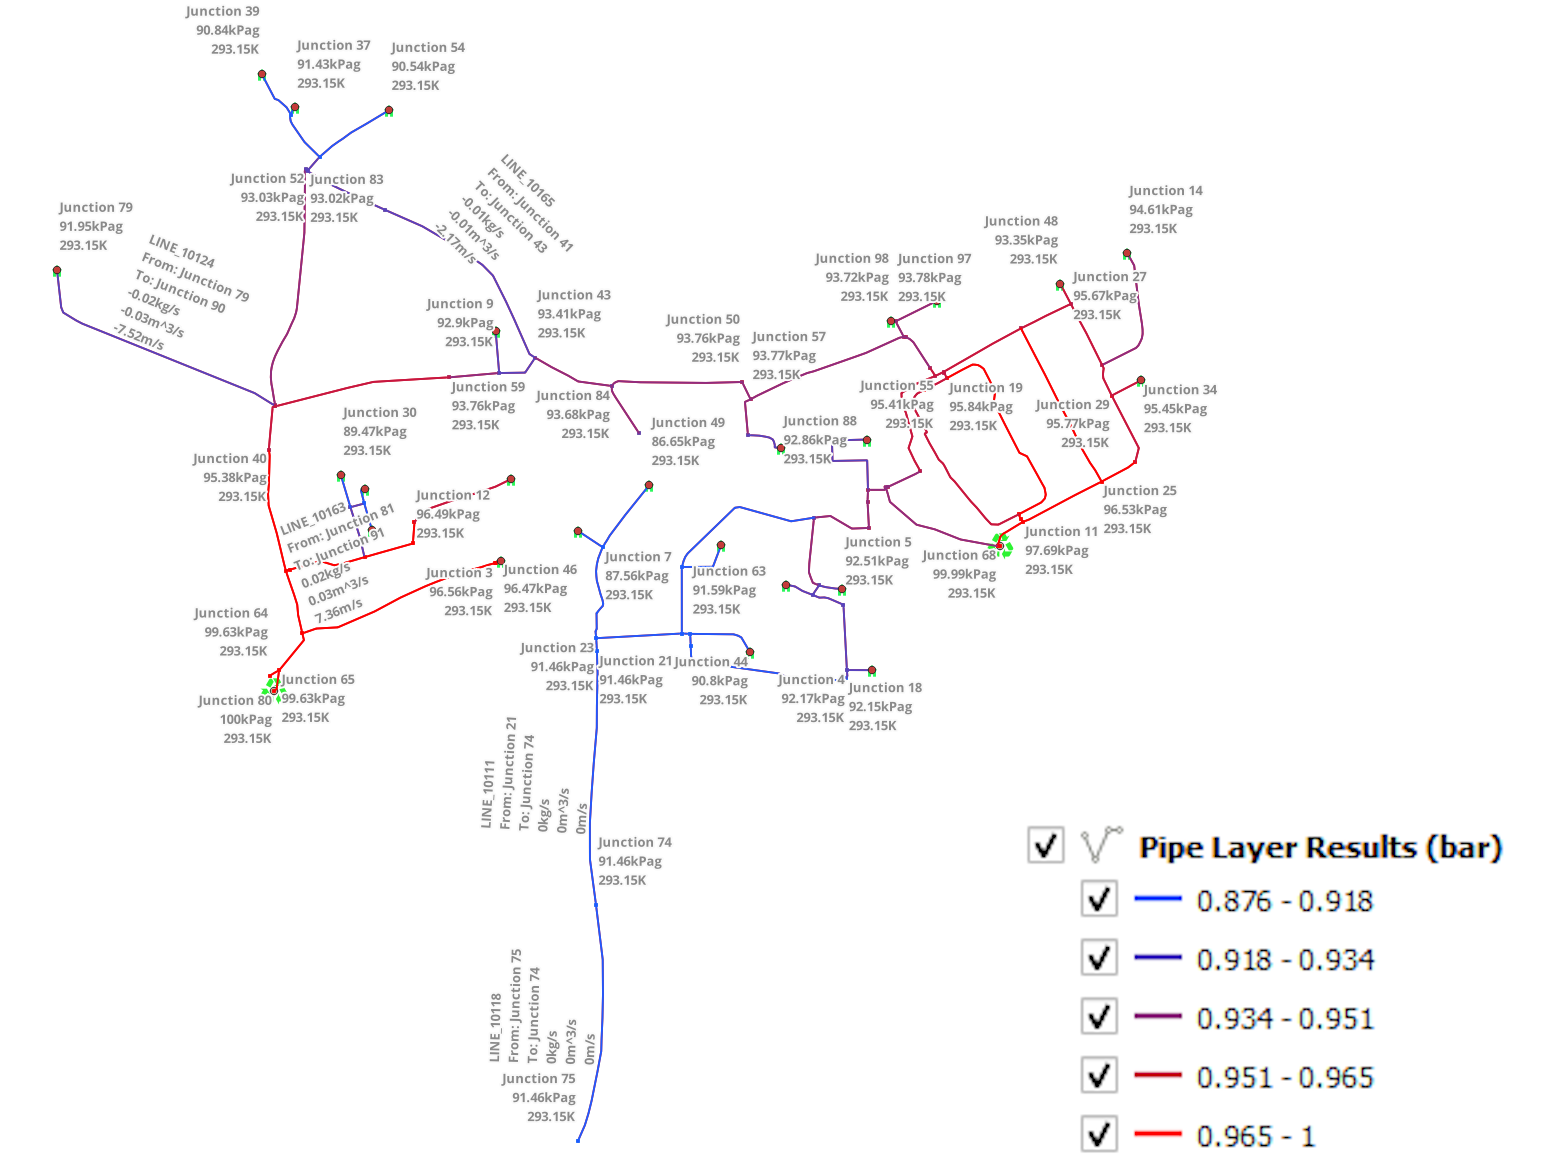
The result of the pipeflow will be loaded into QGIS as a series of layers, each corresponding with one of the Network Layers intially loaded into the pipeflow.
Automation
At the top of the processing toolbox pane, you’ll notice a small clock icon. If you press this, you can access the pipeflow you just ran as code:-
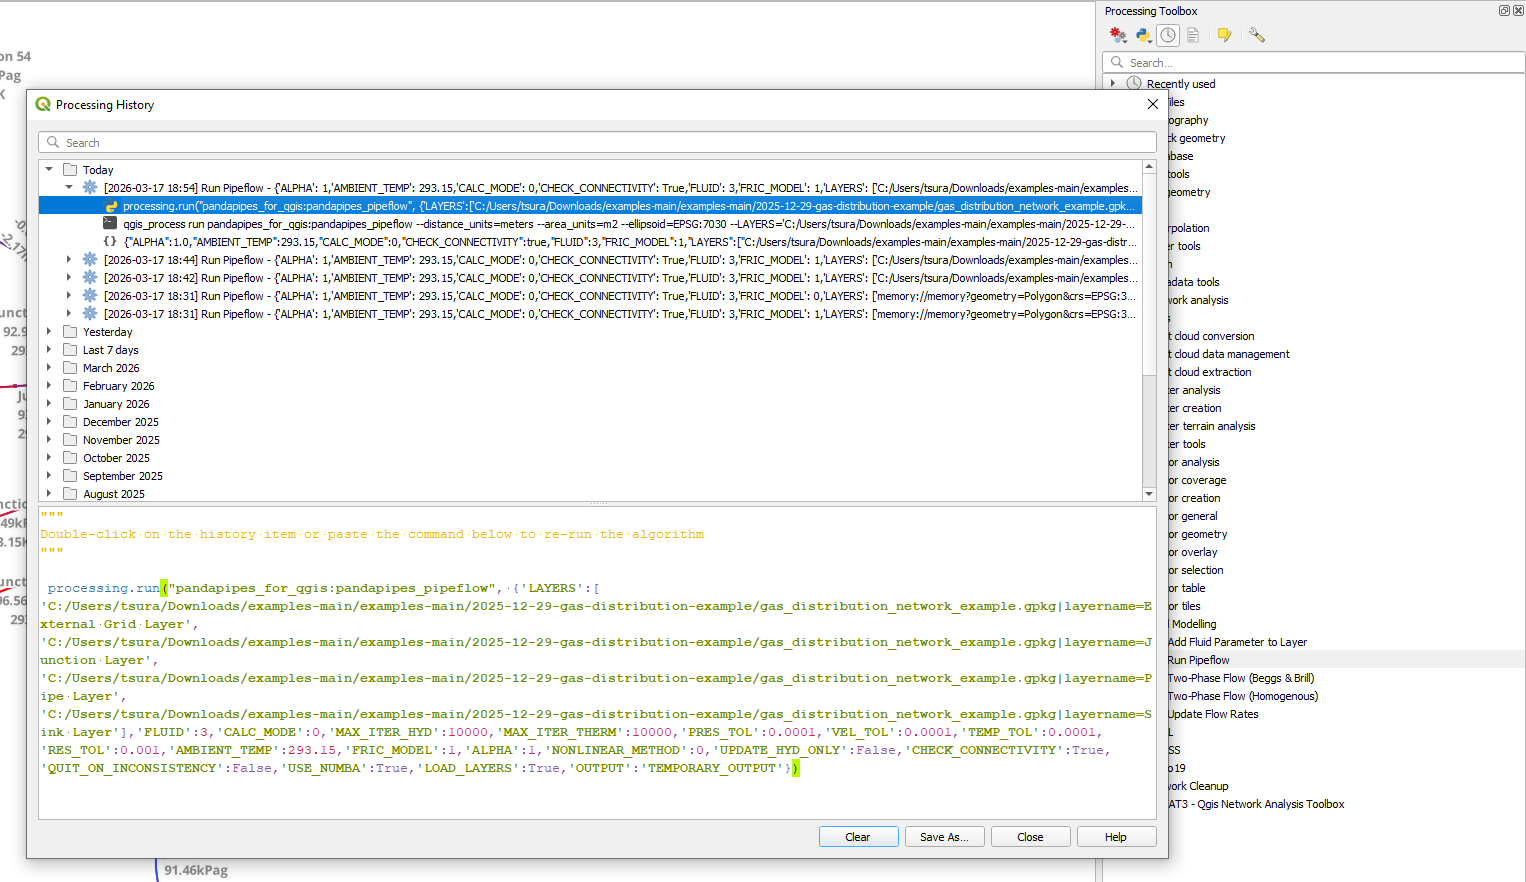
Let’s look at a way we can use this to our advantage.
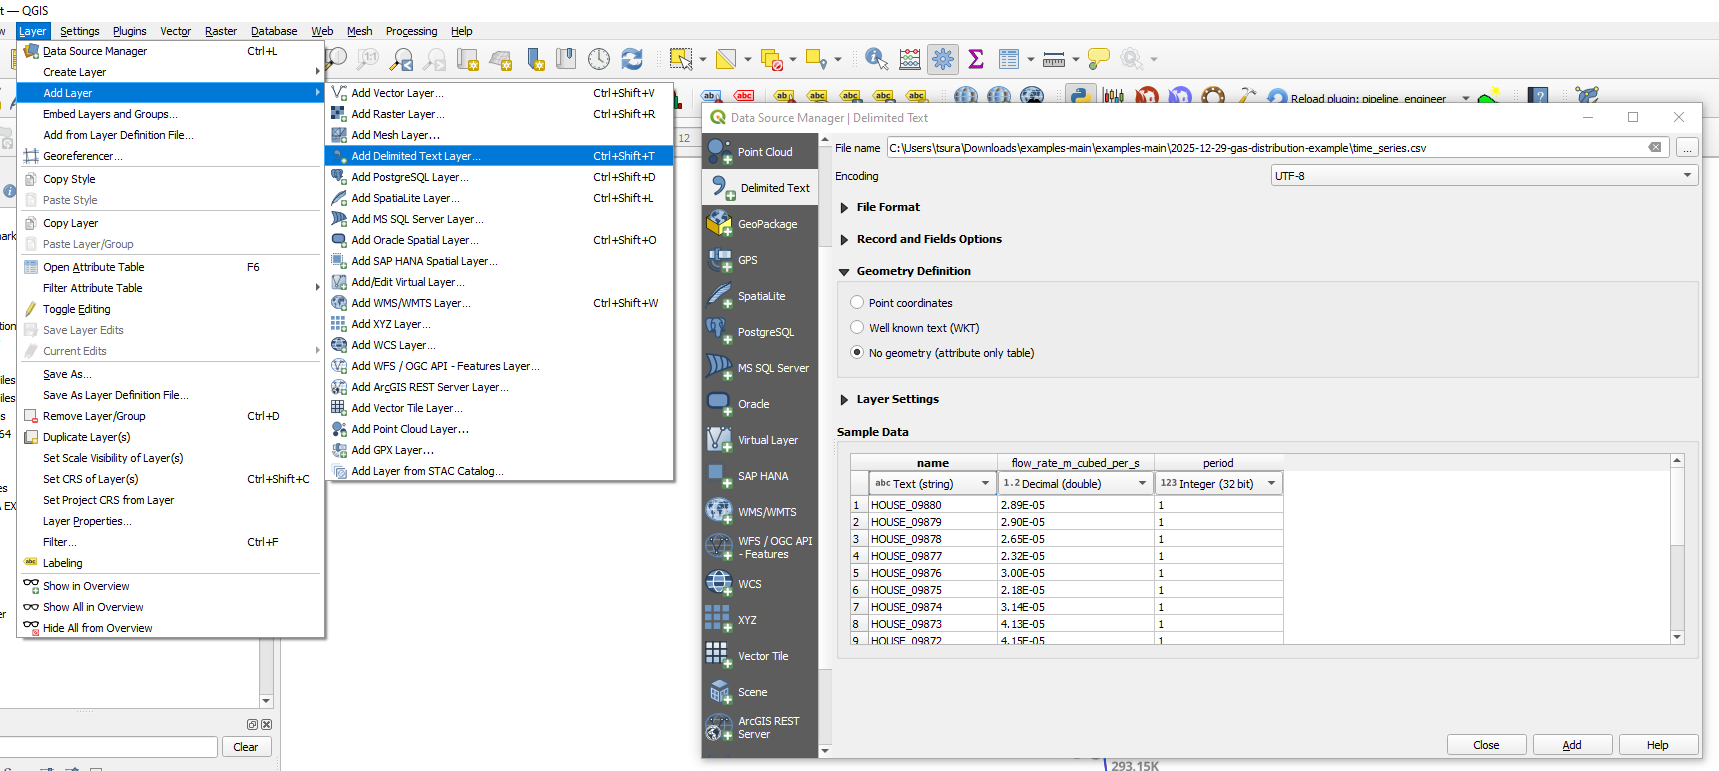
From the examples page, you’ll be able to download a csv file containing a csv file. You can add this csv file from the Add Layer tab.
Through a script, we can access each individual layer of our network, as well as the csv file using the mapLayersByName function.
sink_layer = QgsProject.instance().mapLayersByName('Sink Layer')[0]
grid_layer = QgsProject.instance().mapLayersByName('External Grid Layer')[0]
junction_layer = QgsProject.instance().mapLayersByName('Junction Layer')[0]
pipe_layer = QgsProject.instance().mapLayersByName('Pipe Layer')[0]

flow_rate_data = QgsProject.instance().mapLayersByName('time_series')[0]
We can update the sink layer by using the Pipeline Engineer function update_flow_rates.
We can wrap this in a for loop to run all our scenarios and load them into our QGIS session.
sink_layer = QgsProject.instance().mapLayersByName('Sink Layer')[0]
grid_layer = QgsProject.instance().mapLayersByName('External Grid Layer')[0]
junction_layer = QgsProject.instance().mapLayersByName('Junction Layer')[0]
pipe_layer = QgsProject.instance().mapLayersByName('Pipe Layer')[0]

flow_rate_data = QgsProject.instance().mapLayersByName('time_series')[0]

layers = [grid_layer,junction_layer,pipe_layer]

periods = [1,2,3]

for period in periods:
    period_layers = layers

    sink_layer_updated = processing.run("pandapipes_for_qgis:update_flow_rates",
                                                    {'INPUT':sink_layer,
                                                     'ID_FIELD':'name',
                                                     'FLOW_RATE_FIELD':'mdot_kg_per_s',
                                                     'FLUID':3, # Methane
                                                     'AMBIENT_TEMP':293.15,
                                                     'AMBIENT_PRES':1,
                                                     'FLOW_RATE_DATA':flow_rate_data,
                                                     'DATA_ID_FIELD':'name',
                                                     'SCENARIO_FIELD':'period',
                                                     'SCENARIO':period,
                                                     'DAT_FLOW_FIELD':'flow_rate_m_cubed_per_s',
                                                     'VOLUME_UNITS':7,
                                                     'TIME_UNITS':3,
                                                     'MASS_FLOW_RATE':False,
                                                     'OUTPUT':'memory:'})['OUTPUT']

    sink_layer_updated.setName(f'Period {period} Sink Layer')

    period_layers.append(sink_layer)

    processing.run("pandapipes_for_qgis:pandapipes_pipeflow",
                            {'LAYERS':period_layers,
                             'FLUID':3, # Methane
                             'CALC_MODE':0, # Hydraulics
                             'MAX_ITER_HYD':10000,
                             'MAX_ITER_THERM':10000,
                             'PRES_TOL':0.0001,
                             'VEL_TOL':0.0001,
                             'TEMP_TOL':0.0001,
                             'RES_TOL':0.001,
                             'AMBIENT_TEMP':293.15,
                             'FRIC_MODEL':1, # Colebrook
                             'ALPHA':1,
                             'NONLINEAR_METHOD':0, # Constant
                             'UPDATE_HYD_ONLY':False,
                             'CHECK_CONNECTIVITY':True,
                             'QUIT_ON_INCONSISTENCY':False,
                             'USE_NUMBA':True,
                             'LOAD_LAYERS':True,
                             'OUTPUT':'TEMPORARY_OUTPUT'})
Alternatively, say we don’t want to load each scenario. We can save the results of each scenario into a specified folder:-
sink_layer = QgsProject.instance().mapLayersByName('Sink Layer')[0]
grid_layer = QgsProject.instance().mapLayersByName('External Grid Layer')[0]
junction_layer = QgsProject.instance().mapLayersByName('Junction Layer')[0]
pipe_layer = QgsProject.instance().mapLayersByName('Pipe Layer')[0]

flow_rate_data = QgsProject.instance().mapLayersByName('time_series')[0]

layers = [grid_layer,junction_layer,pipe_layer]

periods = [1,2,3]

for period in periods:
    period_layers = layers

    sink_layer_updated = processing.run("pandapipes_for_qgis:update_flow_rates",
                                                    {'INPUT':sink_layer,
                                                     'ID_FIELD':'name',
                                                     'FLOW_RATE_FIELD':'mdot_kg_per_s',
                                                     'FLUID':3, # Methane
                                                     'AMBIENT_TEMP':293.15,
                                                     'AMBIENT_PRES':1,
                                                     'FLOW_RATE_DATA':flow_rate_data,
                                                     'DATA_ID_FIELD':'name',
                                                     'SCENARIO_FIELD':'period',
                                                     'SCENARIO':period,
                                                     'DAT_FLOW_FIELD':'flow_rate_m_cubed_per_s',
                                                     'VOLUME_UNITS':7,
                                                     'TIME_UNITS':3,
                                                     'MASS_FLOW_RATE':False,
                                                     'OUTPUT':'memory:'})['OUTPUT']

    sink_layer_updated.setName(f'Period {period} Sink Layer')

    period_layers.append(sink_layer_updated)

    path = f'C:/Users/tsura/Downloads/examples-main/results/period_{period}_results.gpkg'

    processing.run("pandapipes_for_qgis:pandapipes_pipeflow",
                            {'LAYERS':period_layers,
                             'FLUID':3, # Methane
                             'CALC_MODE':0, # Hydraulics
                             'MAX_ITER_HYD':10000,
                             'MAX_ITER_THERM':10000,
                             'PRES_TOL':0.0001,
                             'VEL_TOL':0.0001,
                             'TEMP_TOL':0.0001,
                             'RES_TOL':0.001,
                             'AMBIENT_TEMP':293.15,
                             'FRIC_MODEL':1, # Colebrook
                             'ALPHA':1,
                             'NONLINEAR_METHOD':0, # Constant
                             'UPDATE_HYD_ONLY':False,
                             'CHECK_CONNECTIVITY':True,
                             'QUIT_ON_INCONSISTENCY':False,
                             'USE_NUMBA':True,
                             'LOAD_LAYERS':False, ######### Set this value to false to avoid loading in layers
                             'OUTPUT':path})
Closing
In this short example, we’ve covered one of Pipeline Engineer’s greatest strengths - its visual representation of the Pandapipes Pipeflow. In future examples we’ll explore the features of Pipeline Engineer in greater depth. In the meantime, feel free to get in contact if you have any queries about the Plugin or how it might be able to help you in your workflow. Until next time, I hope you have an excellent day!